According to Statista, the global mobile internet penetration has exceeded half the world’s population, while the average daily time spent accessing online content from a mobile device, such as a smartphone, a tablet computer or wearable, has reached 185 minutes daily among Millennials. Currently, the two largest global platforms for app distribution are Apple’s App Store, which caters to iOS users, and Google Play, the official app store for the Android OS. The fact that mobile apps are relatively easier to create than computer apps, as well as their considerably lower price has translated into a growing industry which produce every year more and more. It is impossible to know exactly how many apps are there, but as of March 2018 there were some 3.6 million apps in Google Play alone. So, how to create a successful mobile app winning more customers in fierce competition? What key ingredients do the popular apps possess? In order to figure out these questions, we make some descriptive statistical analysis in this report.
The dataset contains web scraped data of the most popular 1000 apps in Google Play Store, and we use the dataset related to top 1000 apps in score provided by www.kaggle.com to enrich our project. There are 8 features that describe a given app, which are App Category, Rating, Reviews, Size, Installs, Type, Price, Content Rating. We make some descriptive statistical analysis on the dataset and conclude some attributes of these good Apps to give some suggestion to Apps developers.

Fig.1
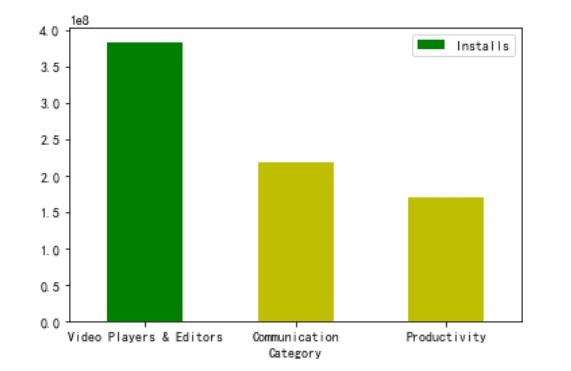
Fig.2
What the quantities are most is the apps related to Tools, Arcade, Action, Entertainment, and Simulation (Fig.1). However, Video Players & Editors, Communication, and productivity are the three kinds of applications downloaded most (Fig.2). The mismatch between supply and users’ demand indicates there is still much room to develop for the apps offering service including playing and editing videos, communication, and productivity.
The graph on the left demonstrates the percentage of category diversity among paid apps, while the diagram on the right shows that among free apps. It is apparent to see that Tools is the most popular category in both free and paid apps. Adventure, Simulation, and Personalization apps are desirable among paid apps, and mobile games apps usually require payment. At the same time, Communication, Social and Shopping applications free of charge are much beloved by users. We suppose these kinds of apps need to provide gratis services in order to attract more users as a large number of users can bring substantial investment.
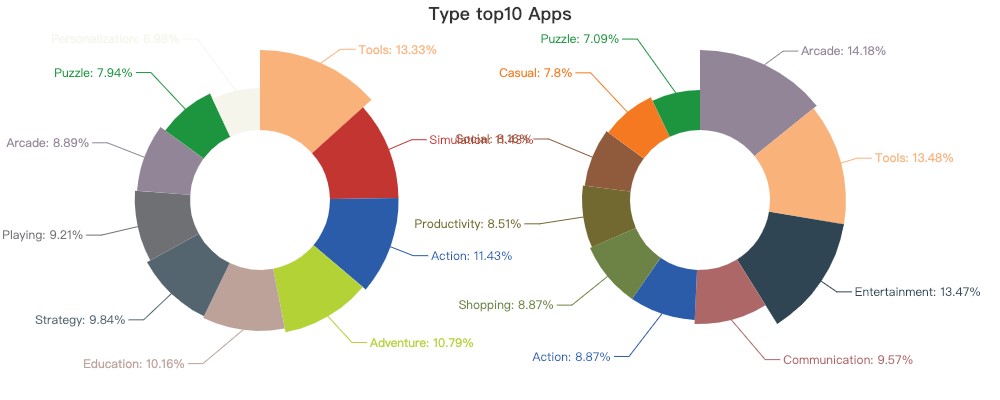
Fig.3
These pie charts show that people are more likely to pay on Personalization and Game, which means app developers need to consider the individuation and funny designs in apps to improve profits. But the prices of apps need to be between a reasonable range, fig.4 shows that the apps costing less than $5 are more popular. Users would not like to pay much for purchasing applications, thus, apps which cost more may need to provide a free trial to increase consuming willingness. Or they can change the sales model, cutting down install price and providing purchasing options within the app, just like some mobile games, we call this “Kejin” model.

Fig.4
The following chart (Fig.5) illustrates that when the sizes are in the range of 15~60 M, users are more likely to install the apps. This conclusion leads to a strategy that developers need to control the size of apps in this range, and if the size of an app cannot be compressed, maybe they should solve this problem by dividing the process of download by many times or updating them step by step.
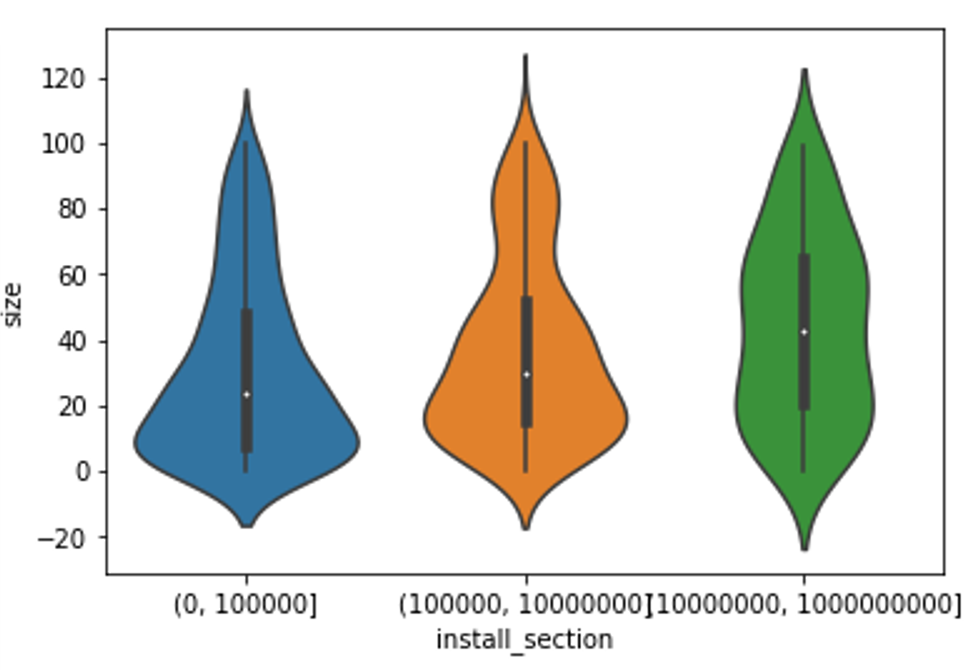
Fig.5
We grab the information of some apps’ reviews and analyze them from Polarity and Subjectivity. When it comes to Polarity, we aim to define if the reviews are positive, negative or neutral. In terms of Subjectivity, the purpose is to determine whether the users’ attitude is subjective or objective.
Facebook gets 4 stars in scoring and Pass obtains only 3 stars. Their detailed information related to comments is shown below:
(1) Polarity:
Fig.6
Fig.7
With a decrease in score, we can come to an agreement that the percentage of positive comments sharply decrease from 45% to 13%, however, there isn’t show an upward trend in the percentage of negative comments. On the contrary, it is neutral which owned a big proportion in the total. Hence it is not difficult to conclude that, among the attitude and comments of an app, the quantity of negative reviews always remains steady. So, the favor of neutrals and their positive comments needs to be wooed for the app developers.
(2) Subjectivity:
Fig.8
Fig.9
From the comparison of pie graphs, we can see that the subjectivity shows more intense in the low scores’ comments. Instead, the positive comments can usually take on the appearance of objectivity. As we suspected, the terrible experience brings bad feelings, such as disappointment, boredom or anger may cause a stronger subjectivity. It is much better for app developers to set the comments pop-up windows after users get a great sense of tremendous fulfillment (such as the situations like the accomplishment of certain tasks or some achievements specific to the game). Certainly, the developers need to avoid the setting of comments pop-up windows after the awful experience (for example, some function modules without improvement). Of course, our analysis is confined on a small scale. If we need to pass the validation of the conjecture or generalize a conclusion, it is possible to complement more samples in subsequent studies.
Also, it is strange to note no matter how much the installs increase, the reviews keep relatively stable with no more than 1k users willing to review (Fig.10). Users' willingness to comment needs to be stimulated by something and the apps developers should not only wait for users to give their positive assessments voluntarily but should guide their users to make positive reviews since it can help to build a good reputation and product image.
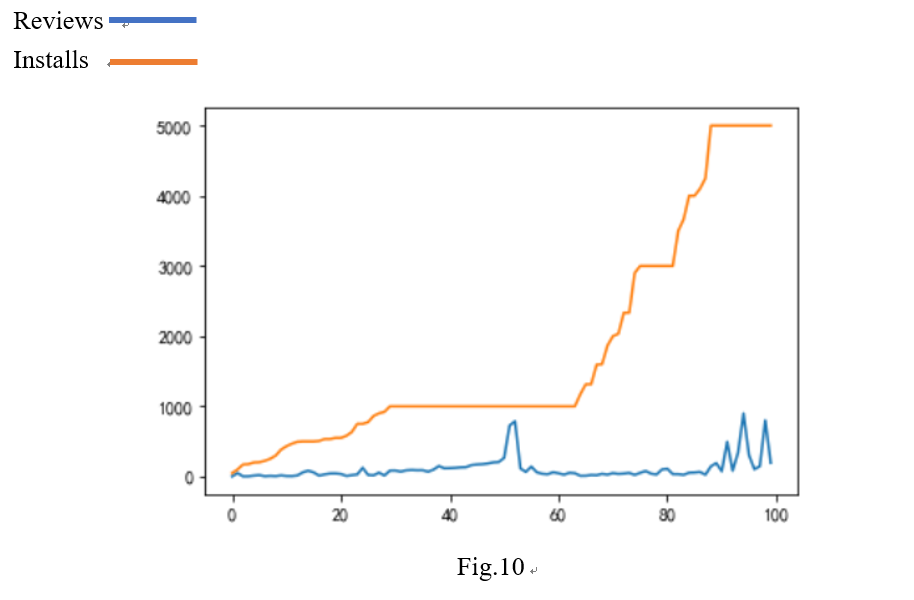
Fig.10
According to the Content Rating, these apps are divided into four types, including Everyone, Teen, Everyone 10+ and Mature 17+. The bar charts show three types except for Everyone (Fig.11 & Fig.12). Considering the inclusion relation, we mainly focus on the Mature 17+ and Teen type. We discovered Social and Game are the two types of apps which are usually popular, and also gain high scores from people; The apps of Music couldn’t achieve a high score, though their capacity of downloading is always large; and also, the apps of Family cannot gain the users’ attention in spite of high-quality. Moreover, the most popular category for adults is social, but it is apparent to see that this market is very mature, both in the quality and quantity. And there are still gaps in the market both for teen and adults in Education.
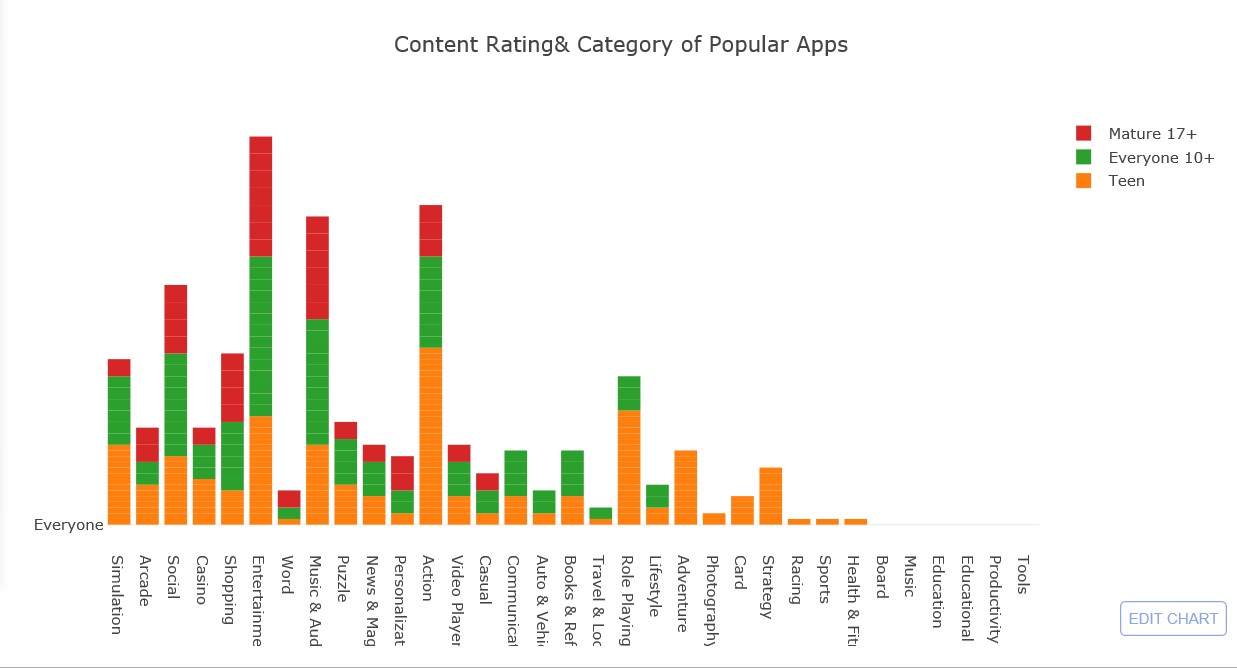
Fig.11
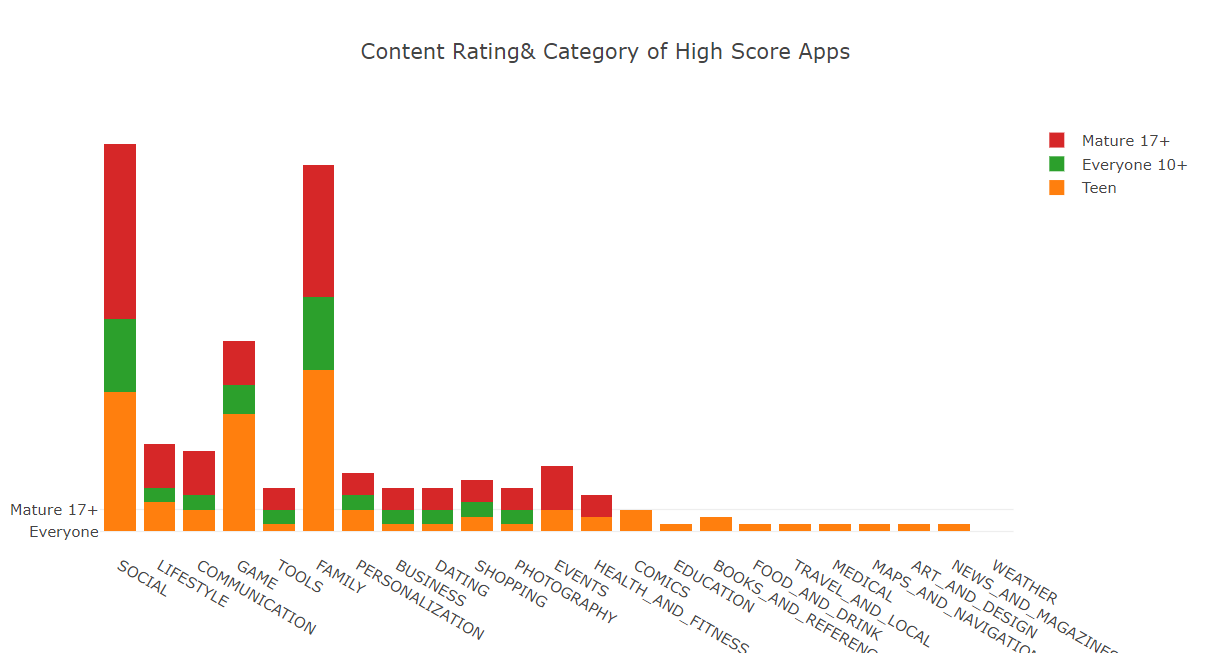
Fig.12
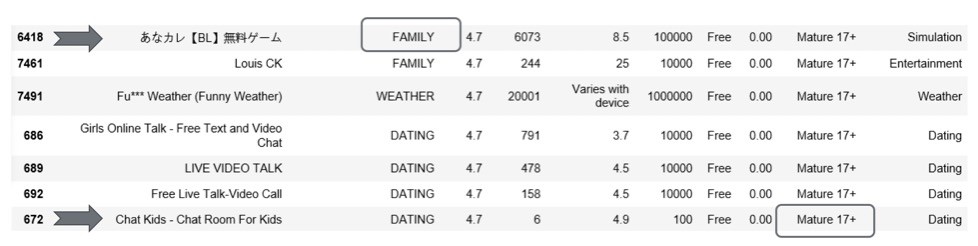
In addition, we find something interesting. Apps related to the category of Family are mainly for parent-child with the function of education or brain games. There are so many family apps under the mature 17plus tag, which we think is very strange. To give an example, the app called anakare, a typical adventure game not for users under 18, is divided into the family category, while Chat room for kids has the mature 17plus tag. We think this may be a marketing strategy - anakare can face less fierce competition under the category of family, as people may be curious about why such a game with an irrelevant label and install it, then its rank on the list will rise. We suppose this is quite a good way of advertising.
If someone wants to create an application, we will give some suggestions related to the following aspects:
Firstly, focusing on the categories like education, travel and video players will make the developers face less fierce competitions. What’s more, since users would not like to pay much for downloading applications, the operators need to adjust pricing so as to offer attractive products at a bearable margin, and it is better to provide a free trail or insider access for purchasing value-added services. Also, control the sizes of apps under 60 M, otherwise divide the process of download by times or updating them step by step. In addition, do not only wait for users to give their assessments voluntarily but should inspire them to make reviews, especially positive reviews. Last but not least, there is a choice for apps’ operators that taking advantage of content rating for advertising, just like we have mentioned before. And there are still gaps in the market for teen and adults, developers can design apps for these two groups.
We hope our project can help you make and promote an app successfully!